I joined Fortune Magazine as they were publishing via Time Inc. As the first interaction designer & coder in their newsroom, I worked with editors and writers to build charts and infographics for data-driven articles. I partnered with the print department to reformat longforms' data visualizations for their web-based counterparts. Also, I ensured all static and interactive graphics had a consistent visual design by creating scalable style guides. All custom-coded graphics were built with HTML, CSS and Javascript. Below are a handful of many examples.
Fortune Magazine
Infographics
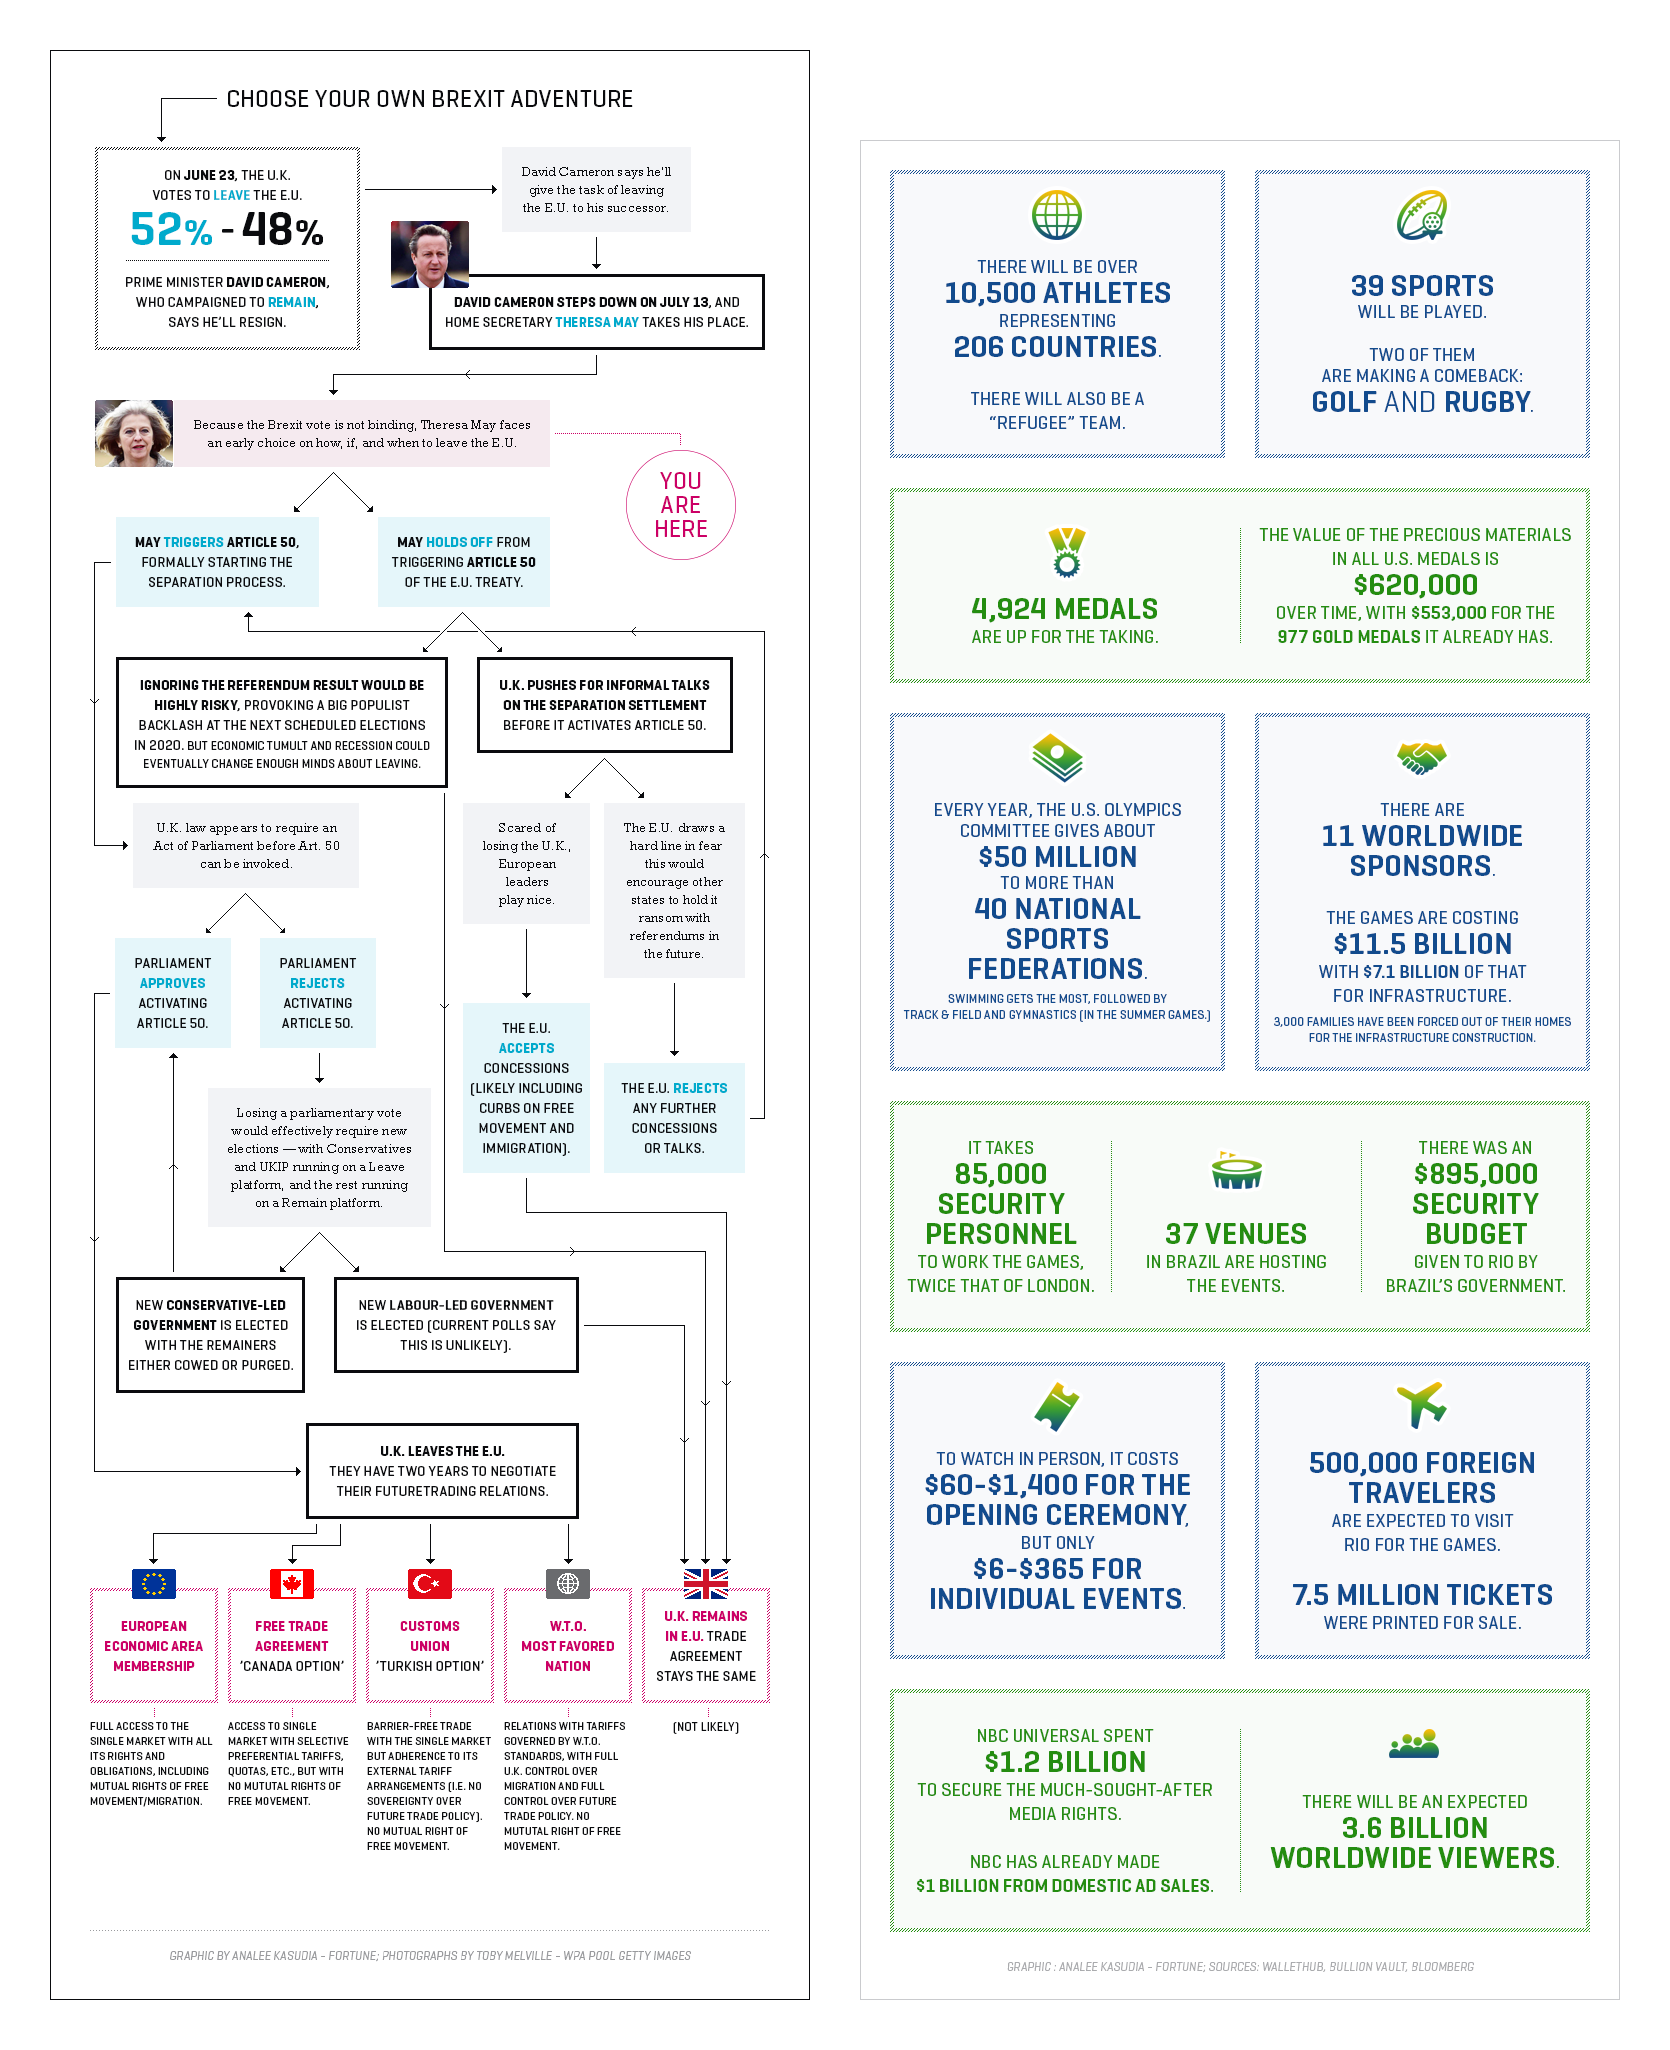
- "Choose Your Own Brexit Adventure" published once Britain had voted to leave the European Union. The flowchart maps scenarios based on the potential actions from the Prime Minister, U.K. parliament, and the E.U.
- "Here's Which U.S. Sports Get The Most Olympic Funding" visualizes various statistics on the 2016 Rio de Janeiro Summer Olympic Games.
Charts and graphics
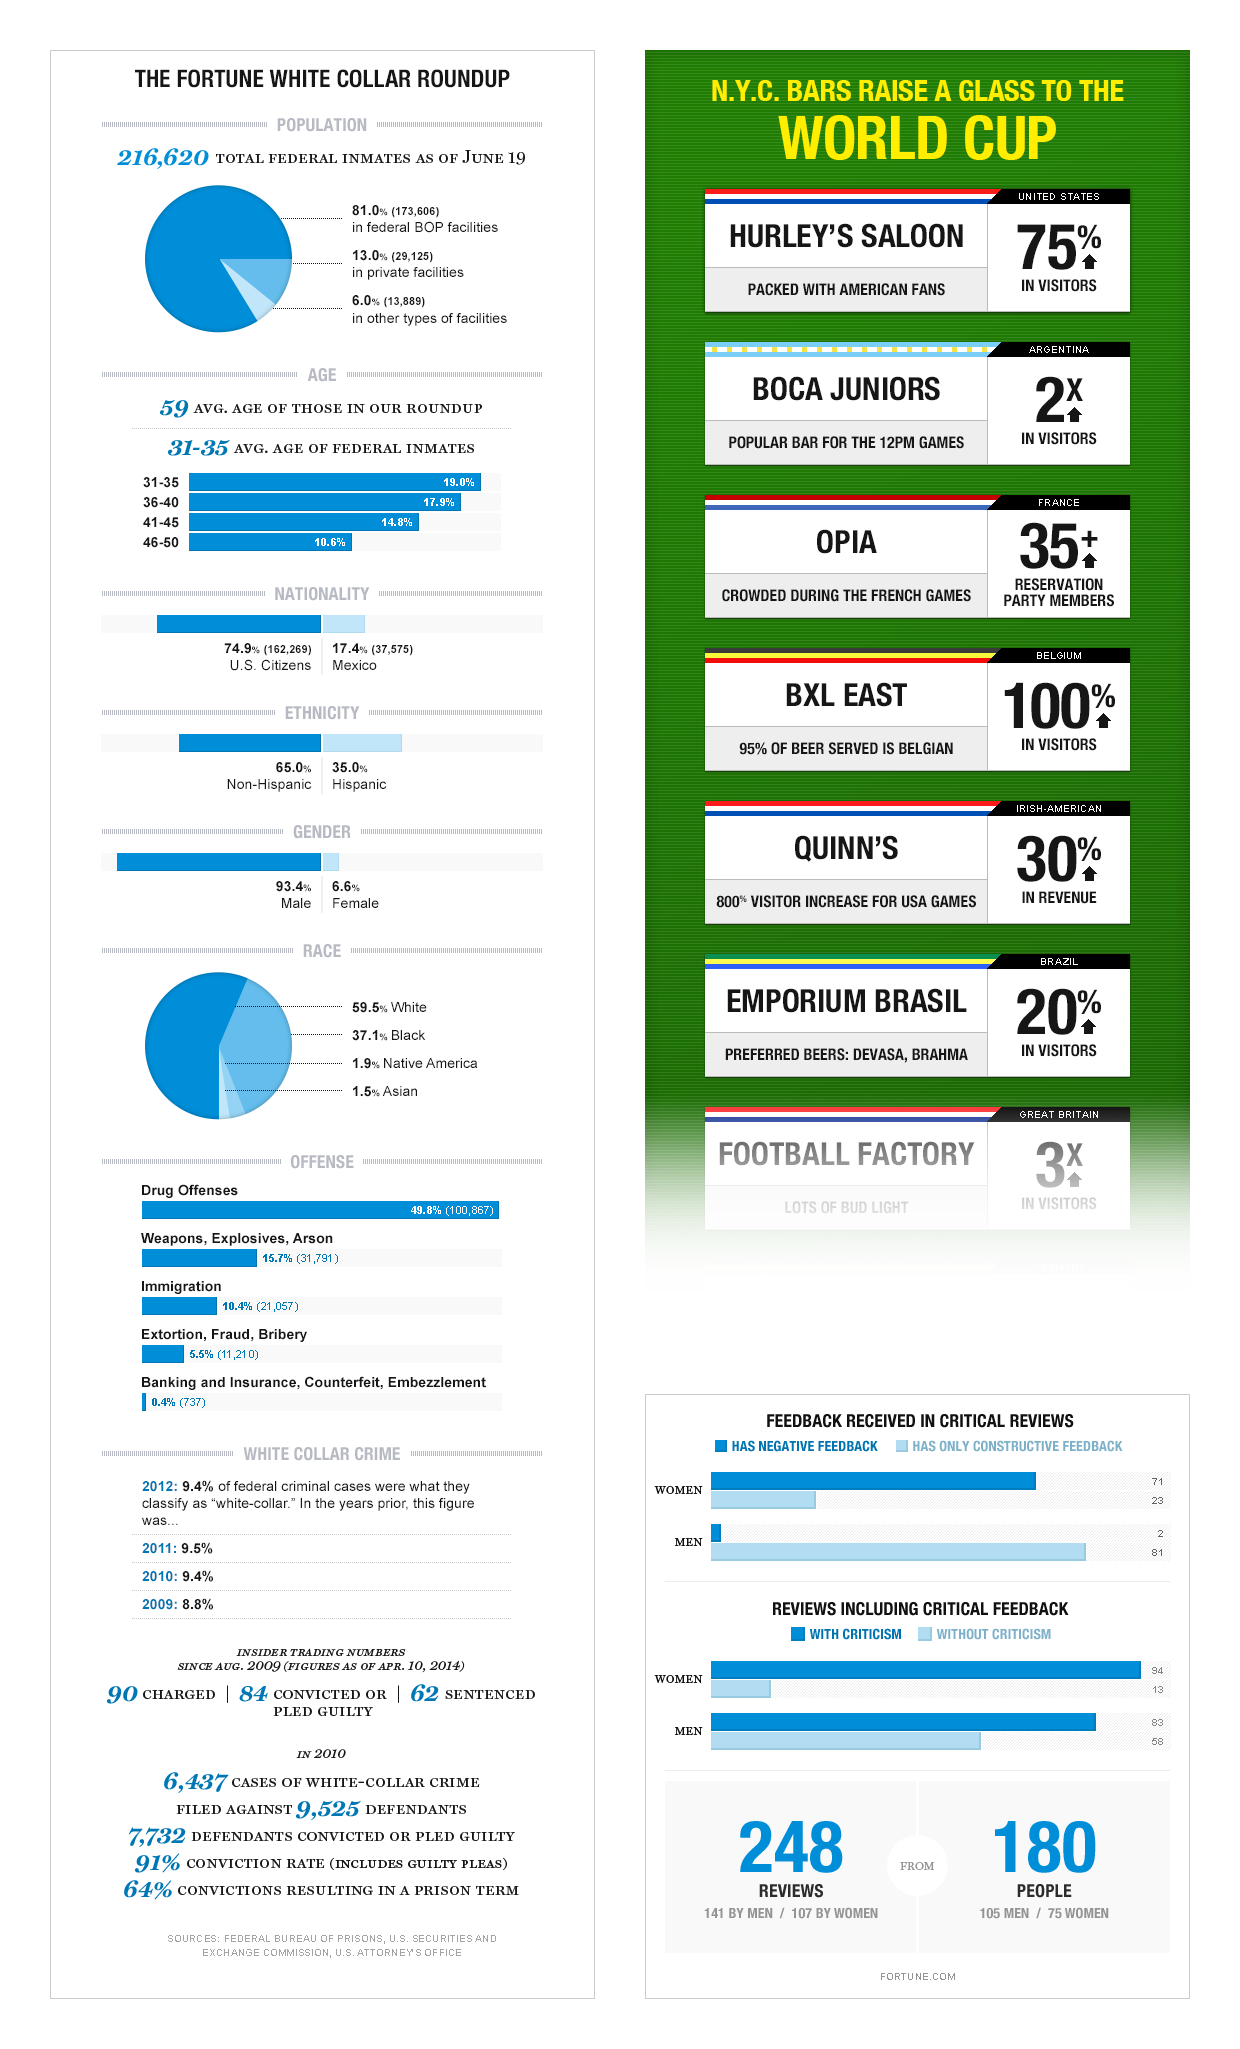
- "Orange is The New White-Collar" charts the demographics of white-collar criminals in the United States between 2009-2014.
- "World Cup Boosts NYC Bars' Bottom Lines" displays the uptick in visitors and revenue of notable New York City bars during the World Cup.
- The last graphic was for an article about the disparity between women and men when they receive feedback in job performance reviews.
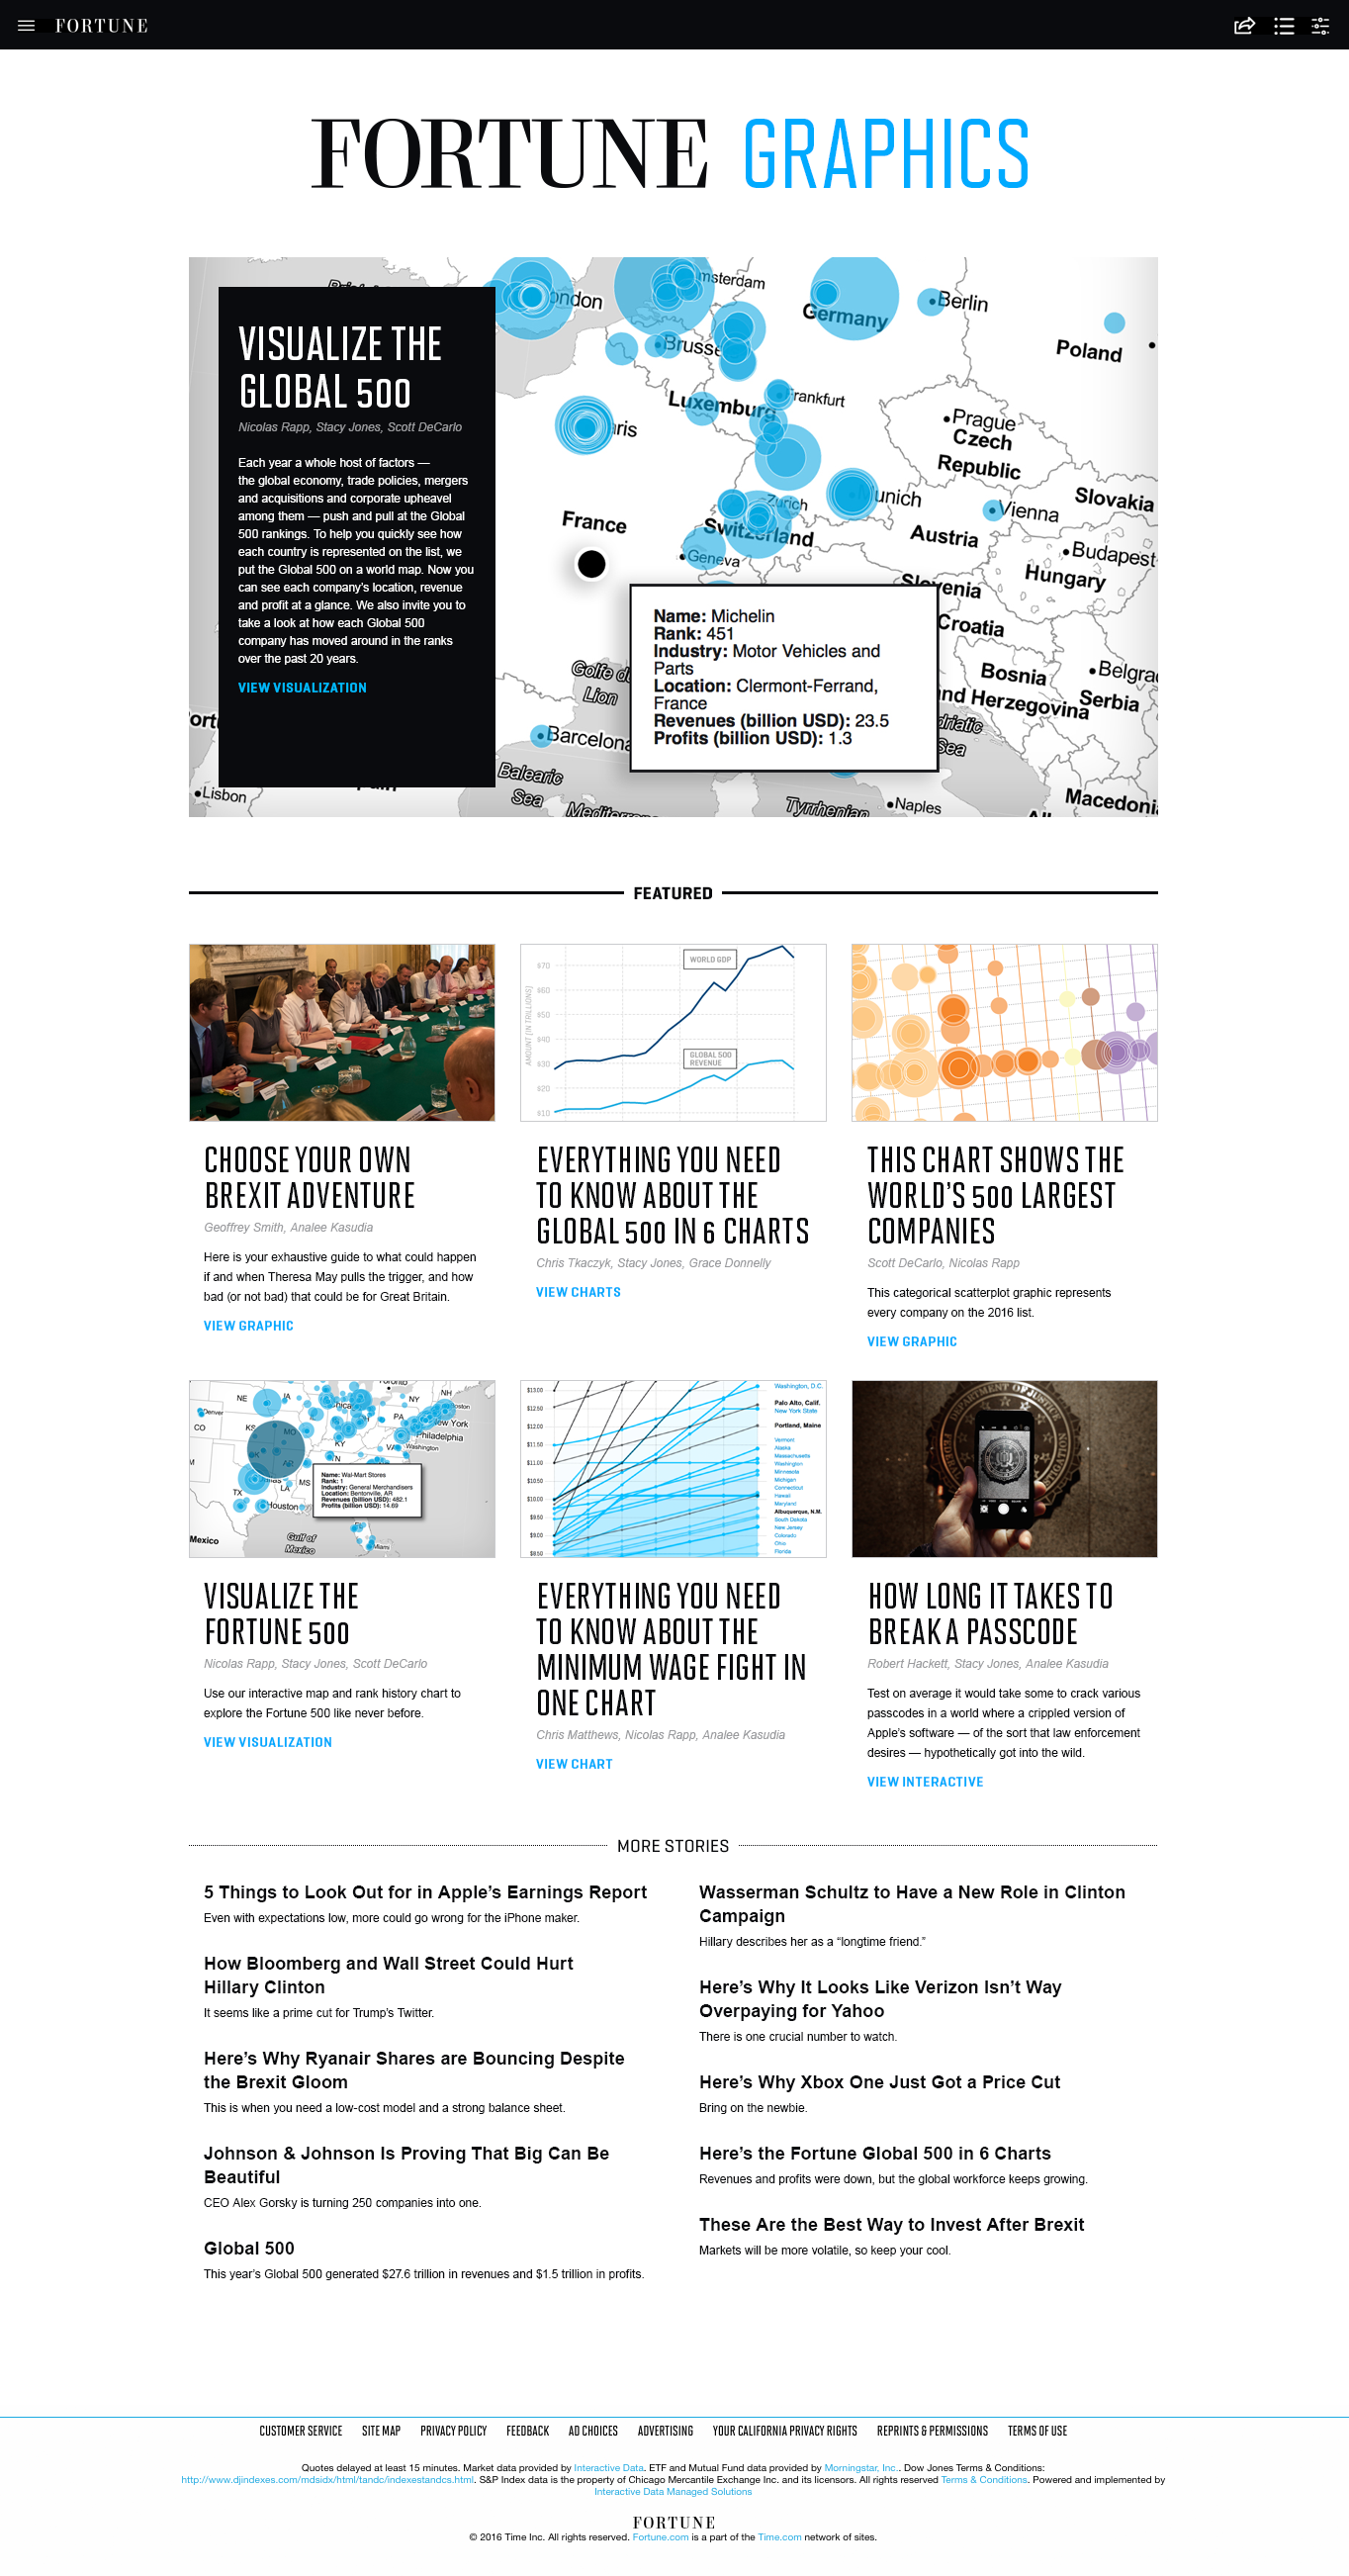
Fortune Graphics landing page concept
Although I was dedicated to the newsroom, I also partnered with the digital team on large-scale initiatives such as concepting a new archive for all of Fortune's dot-com graphics and data visualizations.
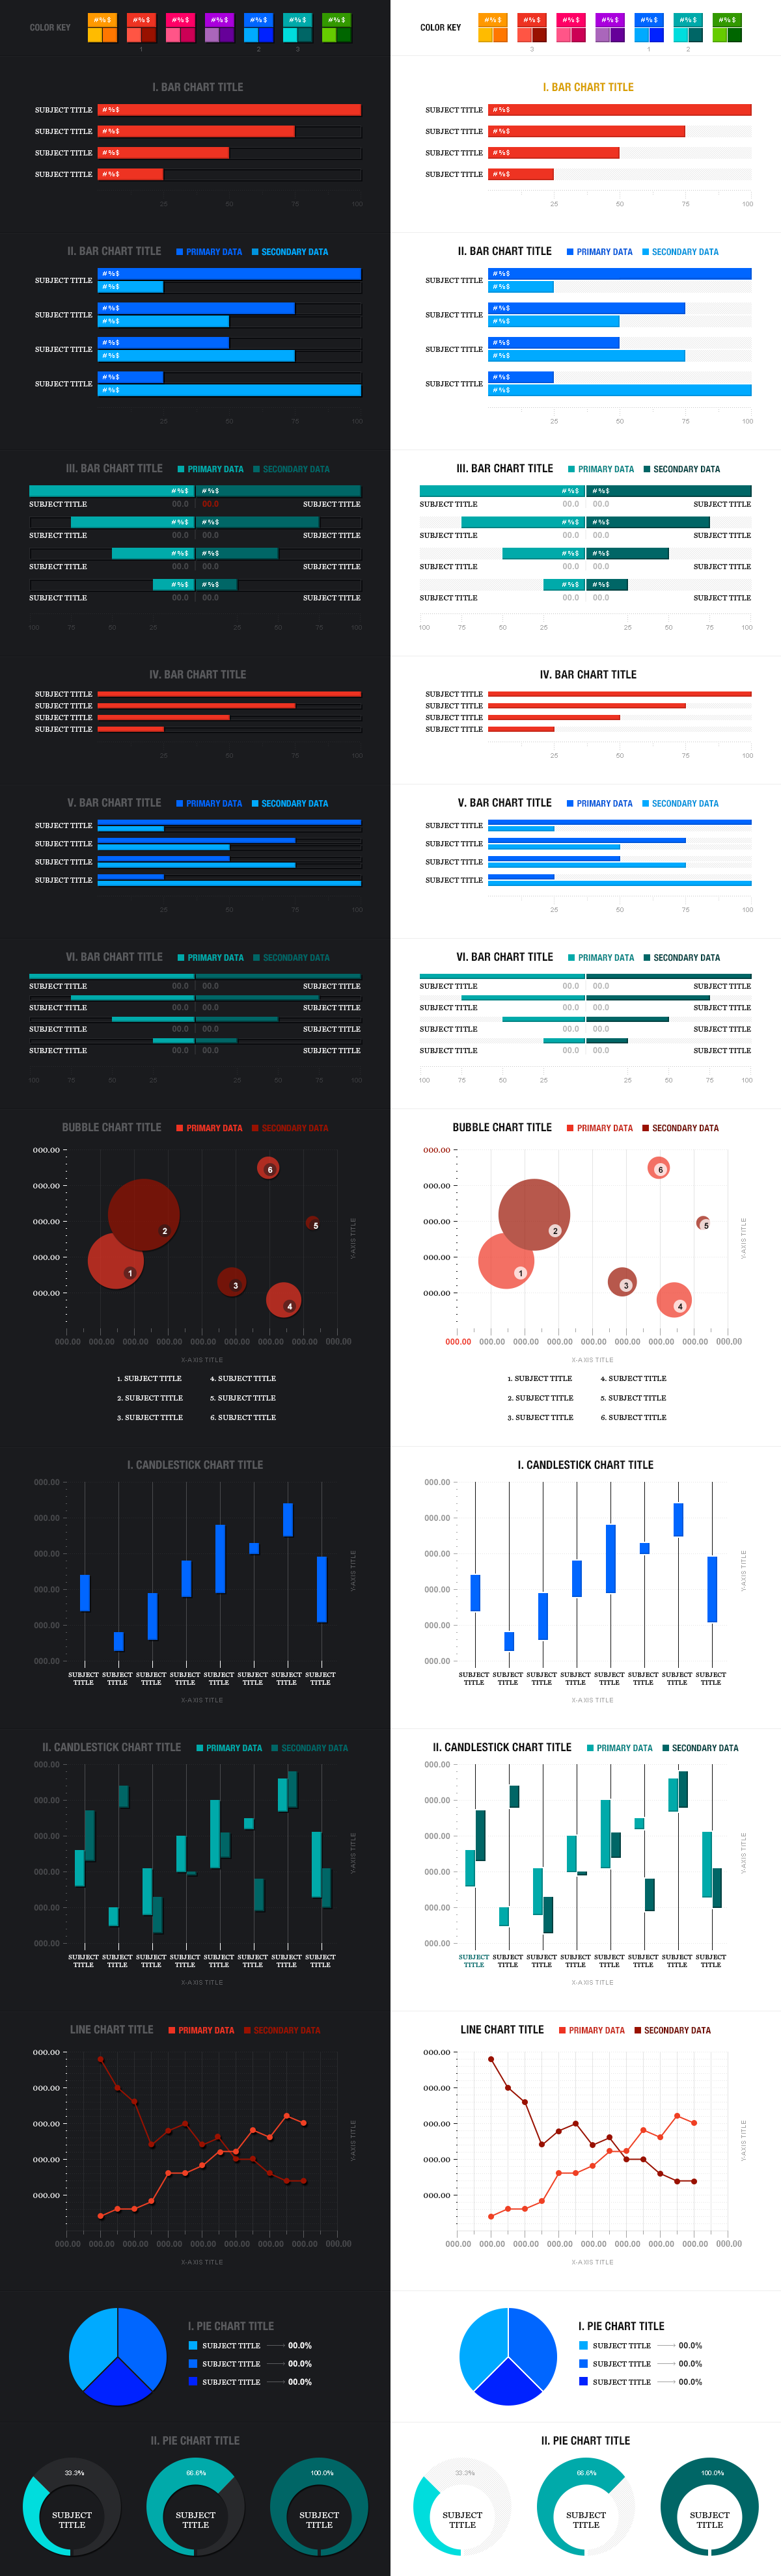
Chart style guide
I developed a templated style guide for all static charts published on Fortune.com. It reinforced a consistent art direction and quickened the turnaround time for creating custom visualizations.